Hackathon Deliverable
Abstract
Forecasting near-term AI incidents is important to help regulators/industry anticipate and mitigate risks. AI Incident Forecasting provides confidence calibration, sensitivity analysis, and uncertainty quantification. We have constructed two models on the AI Incident Database: (1) Poisson (and checked vs negative-binomial) model for annual totals with Year-to-Date (YTD) assimilation, (2) recency-weighted, surge-aware share model; constrained allocator to preserve yearly totals and non-negativity. Rolling backtests vs a naive baseline; report MAE/MAPE, 90% PI coverage (well-calibrated and slightly conservative). We found sharp growth in total incidents over the next five years, with the largest increases in Domain 4 (Malicious Actors), Domain 3 (Misinformation), and Domain 7 (AI system safety). We suggest that future policy interventions for AI should prioritise the largest share of risk domains. Keywords: AI incidents Forecasting, Poisson regression, YTD assimilation, surge-aware shares Code & Colab: GitHub
1 Introduction
Artificial Intelligence (AI) has become a cornerstone of technological progress, driving innovation across nearly every sector. AI systems inform critical decisions in healthcare, finance, human resources, and autonomous transportation. However, the rapid proliferation of AI technologies has also introduced new and complex risks. Data-embedded biases, adversarial model manipulation, and unexpected emergent behaviours have led to an increasing number of AI incidents that harm individuals, organizations, and society at large. AI Forecasting is focused on anticipating the arrival and impact of transformative AI capabilities—a question at the heart of policy planning, safety research, and societal readiness. Traditional forecasting approaches struggle to keep pace with rapid technological breakthroughs, deepening uncertainties, and novel capabilities that often emerge in ways that defy conventional prediction. This research aims to establish a structured forecasting framework capable of modelling possible AI futures, their uncertainties, and the acceleration dynamics that shape them. The central research question that guides this study is the following:
How can AI incidents be accurately forecasted to enable governance bodies, regulators, and industry stakeholders to anticipate and mitigate emerging risk scenarios? We hypothesize that by systematically integrating incident datasets and contextual risk metrics through a dual-model architecture, it is possible to generate probabilistic forecasts of AI incident likelihoods. We do this by using multi-model looking at past incidents and spot sudden changes. We also use a simulation to understand the uncertainty in our predictions, which helps us provide reliable estimates for decision-making, safety assurance, and responsible AI.
The potential impact of this work is substantial and multifaceted. First, it equips regulators and policymakers with evidence-based tools to improve AI regulation, moving beyond reactive measures to proactive governance frameworks that anticipate and prevent harm before it occurs. Second, it guides safe AI deployment strategies by helping organizations identify high-risk scenarios and implement appropriate safeguards during development and deployment. Ultimately, this forecasting capability supports the development of more trustworthy AI systems that can advance innovation while maintaining public safety and social trust.
2 Methods
We address three questions: (RQ1) future trajectories of total and category-level AI incident counts, (RQ2) one-year-ahead accuracy versus a naive baseline, and (RQ3) calibration of prediction intervals.
Data and preprocessing We use the public AI Incident Database augmented with an MIT classification schema [1]]. The dataset (2010–2025) merges incidents and labels on incident ID, extracts year/month, and aggregates annual counts overall and by category (e.g., Risk Domain, Actor, Failure Mode). For backtests, to forecast year t we train on data $\le t-1$ and evaluate on $t$. Implementation uses reusable loaders/mergers.
Model overview The pipeline links (i) a total-count model to forecast annual incident totals and (ii) a category-share model to distribute totals across categories. We then simulate to quantify uncertainty and enforce coherence/monotonicity across totals and categories. Core components are provided as configurable helpers.
Total-count model We fit a generalized linear model (Poisson regression [2]]) to annual totals as a function of time with a trend-change hinge at 2021 and spline flexibility constrained by limited knots and L2 regularization [3]]. Recent years receive exponential sample-weights to prioritize current growth [4]. Monotone post-processing (isotonic regression) prevents implausible dips and enforces a non-decrease in the first forecast year when warranted.
Category-share model We estimate category probabilities via multinomial logistic regression with time-splines [5]. Sample weights combine (a) recency emphasis, (b) surge boosts for categories whose recent share rose above the 75th-percentile change and exceed 5\% share, and (c) size weights using $\sqrt{\text{count}}$ to temper domination by very large years. Shares are later blended with historical and uniform priors that gain weight with horizon length (time-varying mixture).
Year-to-date (YTD) assimilation If partial data exist for the current year, we scale YTD totals by the historical fraction observed by the same month (ratio-to-average) and impose a minimum per-category share (0.35 of its historical average). YTD assimilation is disabled during backtests [6]].
Uncertainty and simulation We run Monte Carlo simulations [7] combining: (i) parameter uncertainty for the Poisson totals via residual bootstrapping; (ii) process uncertainty via an over-dispersed (negative-binomial) growth process [8]; and (iii) Dirichlet draws for category shares around the blended probabilities with concentration $\kappa$. We allocate simulated totals to categories with a growth-allocation routine that preserves coherence and imposes non-decreasing category paths with small floors.
Baseline and evaluation The naive baseline predicts next-year totals as the three-year average scaled by the average recent growth rate; it has no category breakdown or intervals. We evaluate one-year-ahead forecasts using MAE, MAPE, RMSE, and interval quality (90\% coverage and sharpness) [9]. We tune uncertainty parameters (e.g., dispersion, interval scaling) to approach nominal coverage without excessively wide intervals. Backtesting utilities compute metrics, coverage, and simple grid-search tuning.
Reproducibility All analysis is in Python (pandas, scikit-learn). Configuration, forecasting, plotting, and summary-table helpers are provided for reuse.
3 Results
Our data source, the AI Incidents database, reveals incidents, not individual reports. Multiple reports often pertain to a single incident collectively joined together by a single identifier [1]. Therefore, we can expect the severity and the number of people affected by each incident to be much greater than in a single report.
3.1 Forecasting
Total Incidents Looking at Figure 1, we can see that the Poisson GLM model predicts an exponential growth from the current year onwards. We can see initial upward growth, with no dip in the first forecast year, as defined earlier.
The peak of the 90\% prediction intervals covers $\approx2500$ incidents in 2030 compared to 215 in 2025, after assimilation. Therefore, a worst-case scenario is an $\approx11 \times$ increase in reported incidents by 2030. The minimum of the 90\% prediction intervals covers $\approx1250$ reported incidents by 2030, which gives an $\approx6 \times$ increase in reported incidents by 2030 as a best-case scenario.
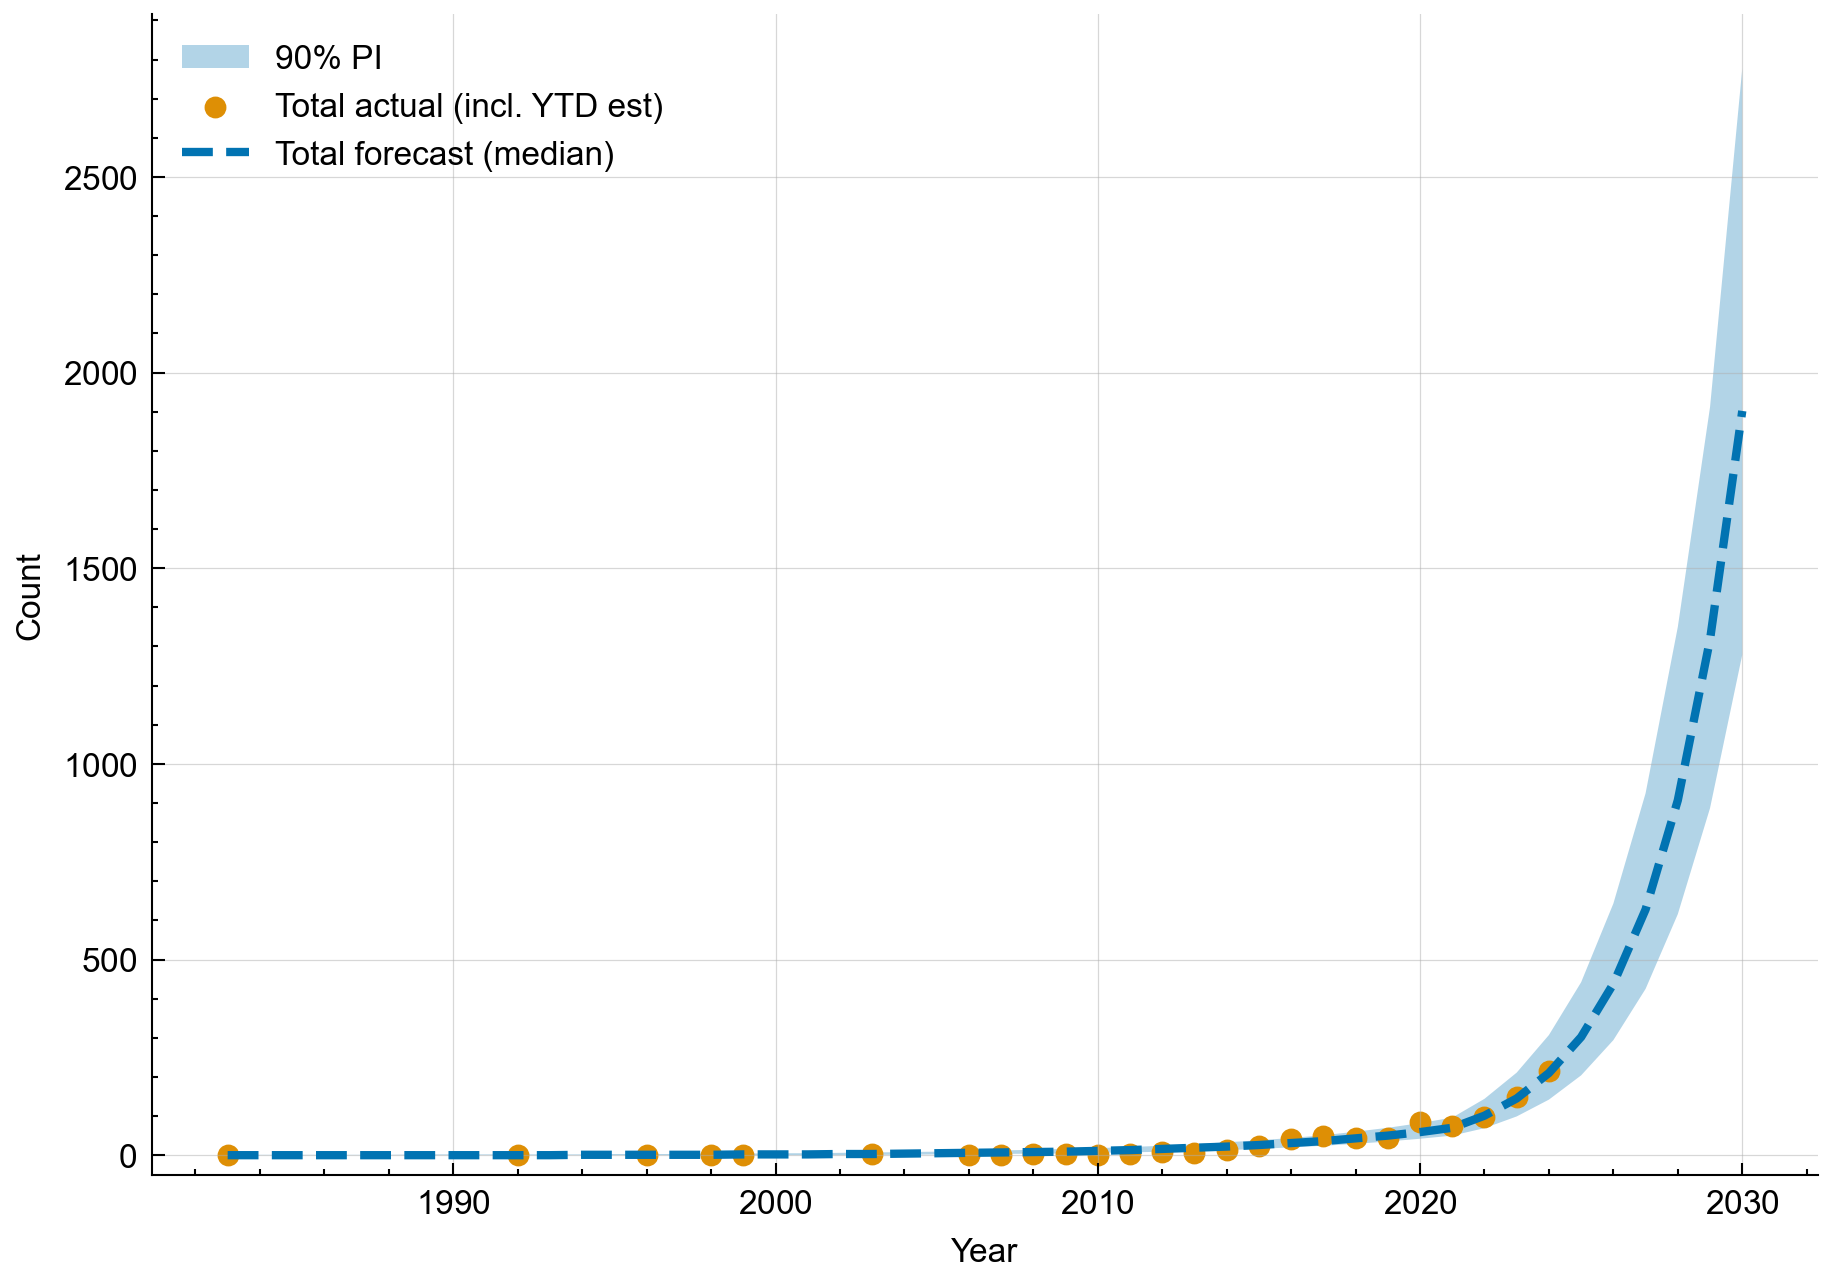 Figure 1: Historical and Forecasted AI Incident Counts (Total) – Actual annual AI incident counts from 2015 through 2024 (orange dots) and the forecast for 2025–2030. The model projects a continuing rise in incident counts. Notably, the forecast for 2025 aligns with the sharp increase observed in 2024, and the prediction interval (light blue band) widens in later years, reflecting greater uncertainty as we move further into the future.
Category Breakdown of Risk Domains Similar to Figure 1, we can see that these category counts rise monotonically over the horizon, with the risk domain of Domain 4 forecasted to make up the most significant proportion of AI incidents in 2030. A constrained allocator converts forecasted shares to category counts while preserving the annual total, so categories sum exactly to the overall total each year, as discussed earlier.
Although only the top three are shown here, the remaining four risk domains exhibit similar exponential growth.
This figure shows only the date range $2005 \rightarrow 2025$. Still, the forecasting model was trained on the full date-range dataset $\approx1990 \rightarrow 2025$, with recency weighting and surge-aware blending that downweight older years.
Looking at Figure 3, we can see the actual and forecasted reported incidents of the risk domain categories. Only the top 3 most reported incidents are shown in Figure 3. These category definitions from Slattery [10] are as follows in Appendix B:
3.2 Backtest Performance
Looking at Figure 2, our main model prediction is much closer to the ground truth than the naive baseline. The naive baseline model estimates closer to the ground truth values for 2022 and 2023; however, the main model forecast is closer to the ground truth value for 2024. The main model underpredicted 2022 by 7.14\% (91 vs. 98), 2023 by 19.46\% (120 vs. 149), and 2024 by 5.12\% (204 vs. 215). Notably, the baseline was closer than the main model in 2023 (127.61 vs. 149) but substantially worse in 2024 (160.03 vs. 215), which drives the main model’s better average performance. Compared to the naive baseline, the main forecasting model more accurately predicts monotonically increasing total counts over the forecast horizon.
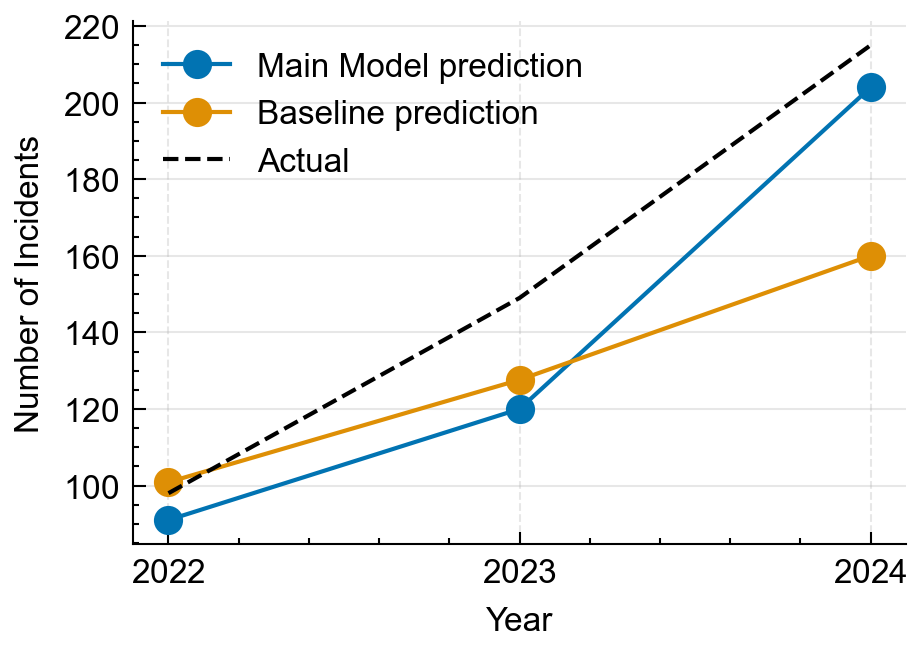 Figure 2: Calibration backtest of annual incident totals (2022–2024). The main model (Poisson regression with a post‑2021 hinge for totals, plus spline‑multinomial shares with horizon blending) is compared against a naive baseline (3‑year mean scaled by average growth). For each test year y, models are trained on all data from years $<$ y with YTD assimilation disabled; markers show one‑step‑ahead point forecasts, and the dashed black line shows realized totals.
Held-out backtests (2022–2024) show improved point accuracy over a naïve baseline: MAE 15.7 vs.\ 26.4, MAPE 10.6\% vs.\ 14.3\%; RMSE matches MAE because each split evaluates a single one-step-ahead prediction. Uncertainty is calibrated by tuning the growth-uncertainty factor: 0.686 achieves full coverage (1.00) across the three held-out years with an average relative PI width of 1.682. Factors near 0.60 covered only 2/3 of the years (missed 2023). The Poisson GLM for totals and constrained share-to-count allocator yield monotone, recency-weighted trajectories consistent with the sharp 2024 increase and avoid a dip in the initial forecast year.
3.3 Calibration of Uncertainty
We tuned the growth-uncertainty factor to align empirical coverage with a nominal 90\% prediction interval. Factors near 0.60 achieved only 2/3 coverage (miss at 2023). Starting around 0.70, all three held-out years fell inside the predicted intervals (coverage = 1.00). The selected setting, 0.686, achieved full coverage on the backtest with an average relative interval width of 1.682, indicating slightly conservative but well-calibrated uncertainty for these years.
4 Discussion and Conclusion
Our incident-forecasting framework produces interpretable forecasts with quantified uncertainty and competitive out-of-sample accuracy. The model projects sustained growth through 2030: the median total rises from 302 in 2025 to 1{,}902 in 2030 (Table 2). The 90\% PI in 2030 spans roughly 1,250–2,500 incidents; relative to 2025 (215 after assimilation), this corresponds to an approximate $6\times$–$11\times$ increase. Category forecasts preserve annual totals by construction and indicate continued growth across domains.
Policy drivers. EU AI Act (full effect: Aug 2026) prohibits unacceptable-risk applications (e.g., harmful manipulation/exploitation). We expect a near-term rise in recorded incidents (due to better detection/reporting) and a longer-term reduction in severe failures/misuse. EU DSA (obligations since Feb 2024) imposes platform-level duties for AI-generated content (risk assessments, synthetic-media marking), likely increasing reported incidents in the short term. Because training includes 2024, status-quo forecasts for 2025+ may slightly overestimate counts in the most affected domain(s).
Domain knowledge \& future work. (1) Reporting-delay correction: incidents enter with publication lag, so YTD undercounts true 2025 totals. We propose estimating the delay distribution from weekly snapshots (since Mar 2021) to nowcast missing tail and feed delay-adjusted counts into totals/shares. (2) From reported incidents to harm rate: reported counts reflect true occurrence and exposure/reporting. For policy, the relevant quantity is the harm rate; media-coverage signals (e.g., GDELT) can proxy exposure for bounding under-reporting. (3) Granular forecasts: extend to affected groups and alleged developers available in the dataset.
Policy recommendations. Prioritize capability and access-control measures in the most rapidly growing domains, including stronger pre-deployment safety evaluations, red-teaming, and staged release; these complement ongoing DSA enforcement and the forthcoming EU AI Act.
References
[1] Sean McGregor. Preventing repeated real world ai failures by cataloging incidents: The ai incident database, 2020. URL https://arxiv.org/abs/2011.08512. [2] Peter McCullagh and John A. Nelder. Generalized Linear Models. Chapman & Hall, 2nd edition, 1989. [3] Trevor J. Hastie and Robert J. Tibshirani. Generalized Additive Models. Chapman & Hall, London, 1990. [4] Everette S. Gardner. Exponential smoothing: The state of the art. Journal of Forecasting, 4(1):1–28, 1985. [5] Alan Agresti. Categorical Data Analysis. John Wiley & Sons, Hoboken, NJ, 3rd edition, 2013. [6] Spyros Makridakis, Steven C. Wheelwright, and Rob J. Hyndman. Forecasting: Methods and Applications. John Wiley & Sons, New York, 3rd edition, 1998. [7] Chris Chatfield. Calculating interval forecasts. Journal of Business & Economic Statistics, 11(2): 121–135, 1993. [8] A. Colin Cameron and Pravin K. Trivedi. Regression Analysis of Count Data. Cambridge University Press, Cambridge, UK, 2nd edition, 2013. [9] Tilmann Gneiting, Fadoua Balabdaoui, and Adrian E. Raftery. Probabilistic forecasts, calibration and sharpness. Journal of the Royal Statistical Society: Series B (Statistical Methodology), 69(2):243–268, 2007. [10] Peter Slattery, Alexander K. Saeri, Emily A. C. Grundy, Jess Graham, Michael Noetel, Risto Uuk, James Dao, Soroush Pour, Stephen Casper, and Neil Thompson. The ai risk repository: A comprehensive meta-review, database, and taxonomy of risks from artificial intelligence, 2025. URL https://arxiv.org/abs/2408.12622.
A Security Considerations
Assumptions include stable reporting intensity and taxonomy; a monotonic total may overstate levels if policy rapidly reduces incidents; annualization relies on historical seasonality (an unusual 2025 timing could bias estimates); data sparsity in smaller categories increases sensitivity to shrinkage; and the dataset reflects publicly reported incidents rather than a full census.
B Risk Domain Definitions
Domain 1. Discrimination \& Toxicity Risks related to unfair treatment, harmful content exposure, and unequal AI performance across different groups and individuals. Domain 2. Privacy \& Security Risks related to unauthorized access to sensitive information and vulnerabilities in AI systems that can be exploited by malicious actors. Domain 3. Misinformation Risks related to AI systems generating or spreading false information that can mislead users and undermine shared understanding of reality. Domain 4. Malicious Actors \& Misuse Risks related to intentional misuse of AI systems by bad actors for harmful purposes, including disinformation, cyberattacks, and fraud. Domain 5. Human-Computer Interaction Risks related to problematic relationships between humans and AI systems, including overreliance and loss of human agency. Domain 6. Socioeconomic \& Environmental Risks related to AI’s impact on society, economy, governance, and the environment, including inequality and resource concentration. Domain 7. AI system safety, failures, and limitations Risks related to AI systems that fail to operate safely, pursue misaligned goals, lack robustness, or possess dangerous capabilities.
C Figures and Tables
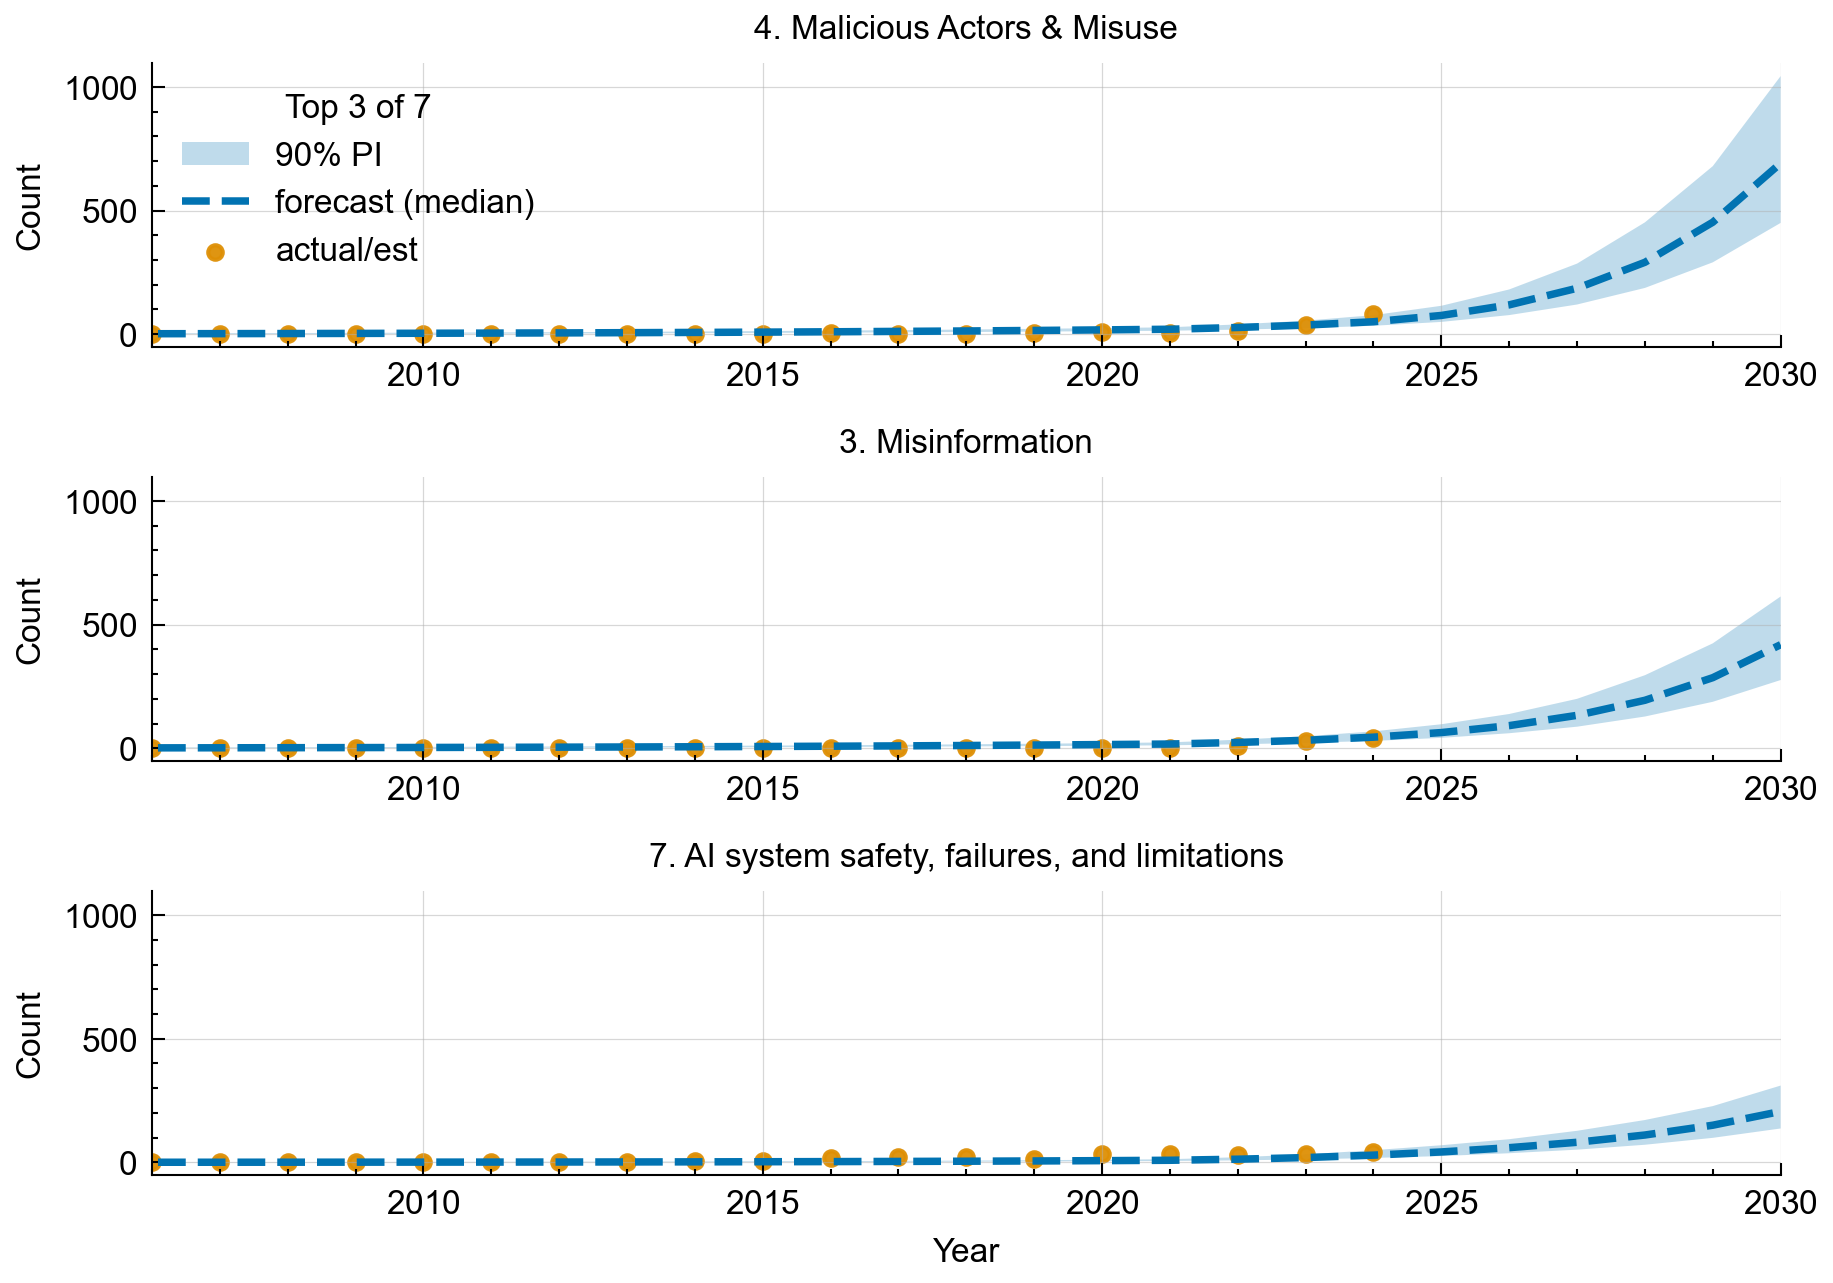 Figure 3: Forecasted Incident Counts by Category – Projected annual incident counts for the top five incident categories, shown as individual subplots. In each subplot, orange markers show historical incident counts for that category (through the last observed year, 2024); the dashed line shows the model’s median forecast from 2025 onward; and the shaded area shows the 90\% prediction interval for that category. All shown categories are expected to experience growth. Categories that saw a recent surge (e.g., Natural Language Processing Incidents in 2023–2024) initially have a steeper forecast trajectory. The uncertainty bounds are wider for categories with historically volatile trends or fewer data points (e.g., Autonomous Vehicle Incidents), indicating lower confidence in those projections.
Table 1:
| Model | MAE | MAPE | RMSE |
|---|---|---|---|
| Baseline | 26.4 | 14.3 | 26.4 |
| Main Model | 15.7 | 10.6 | 15.7 |
Table 2: Historical AI-incident counts by Risk Domain (2021–2024). Values are annual totals recorded in the dataset. Median forecast of AI-incident counts by Risk Domain (2025–2030). Values are medians; 90% prediction intervals are shown in the figures.
| Risk Domain | 2023 | 2024 | 2025 | 2026 | 2027 | 2028 | 2029 | 2030 |
|---|---|---|---|---|---|---|---|---|
| Discrimination and Toxicity | 19 | 26 | 37 | 52 | 72 | 98 | 133 | 181 |
| Privacy & Security | 14 | 12 | 30 | 40 | 53 | 70 | 93 | 123 |
| Misinformation | 31 | 40 | 64 | 92 | 133 | 194 | 286 | 419 |
| Malicious Actors & Misuse | 39 | 83 | 76 | 118 | 186 | 291 | 453 | 691 |
| Human–Computer Interaction | 7 | 10 | 30 | 43 | 63 | 92 | 133 | 190 |
| Socioeconomic & Environmental Harms | 5 | 4 | 20 | 27 | 36 | 47 | 62 | 82 |
| AI system safety, failures, and limitations | 34 | 40 | 42 | 59 | 81 | 111 | 150 | 206 |
| Total | 149 | 215 | 302 | 438 | 628 | 907 | 1,318 | 1,902 |