AI Incident Forecasting
tl;dr
We trained statistical models on the AI Incidents Database and predicted that AI-related incidents could increase by 6-11x within the next five years, particularly in misuse, misinformation, and system safety issues. This post does not aim to prescribe specific policy interventions. Instead, it presents these forecasts as evidence to help prioritize which risk domains warrant policy attention and deeper evaluation.
Introduction & Motivation
As AI systems become part of society, real-world problems like misinformation, misuse, and unsafe behavior are increasing rapidly, often surprising those involved. Can we predict the next AI disaster before it strikes? To prevent harm rather than just react, we need a systematic, data-driven approach to predict AI incidents before they occur, enabling policymakers and developers to take early action. We built models to predict how many incidents will occur in the future and how they will be distributed across different risk areas, training on data from the AI Incident Database, a historical record of reported AI Incidents. Our forecasts show urgency; the number of recorded incidents each year could be 6 to 11 times higher by 2030, especially for misuse, misinformation, and system safety issues. This post explains the approach and results, highlights what the forecast can and cannot tell us, and outlines the next steps to make incident forecasting more useful for governance. We expect this forecast to be used by regulators and standards bodies to plan oversight capacity, and by policy think tanks, civil society, and AI developers to justify and guide where to focus evaluation and monitoring. In practice, it could be published as an annually updated public brief or dashboard reporting totals, risk-domain shares, and uncertainty ranges.
Methods
Definitions
An “AI incident” is vague in common use. In our research, we use a simple definition: a real-world event where an AI system causes or nearly causes harm. Forecasting incidents means estimating how often these events might occur in the future and what types of incidents we’re likely to see. Note that we use incidents, not individual reports. The AI incidents database aggregates many reports into one incident; each incident may involve greater severity and affect more people than any one report suggests
Similar Work
We used the AI Incident Database, but AI incidents are increasingly tracked in resources such as emerging public reporting efforts (for example, the OECD’s AI Incidents and Hazards Monitor and its incident reporting framework). While many governance frameworks prioritize tracking risks over time, most existing incident work focuses on describing the past instead of estimating future incidents. Our work starts to bridge this gap, which is essential for proactive risk management. The closest existing work is Stanford’s 2025 AI Index and Our World in Data descriptive trend report on AI Incident Database counts, which tracks annual AI incidents (including 233 in 2024) to show how incident reporting evolves over time, but it does not build or evaluate forecasting models. Unlike previous resources, our work builds a statistical forecast using mathematical models that project both the total number of recorded incidents and how that total is likely to split across incident types (risk domains*). We report calibrated uncertainty ranges, showing where our predictions might fall, rather than offering a single best guess.
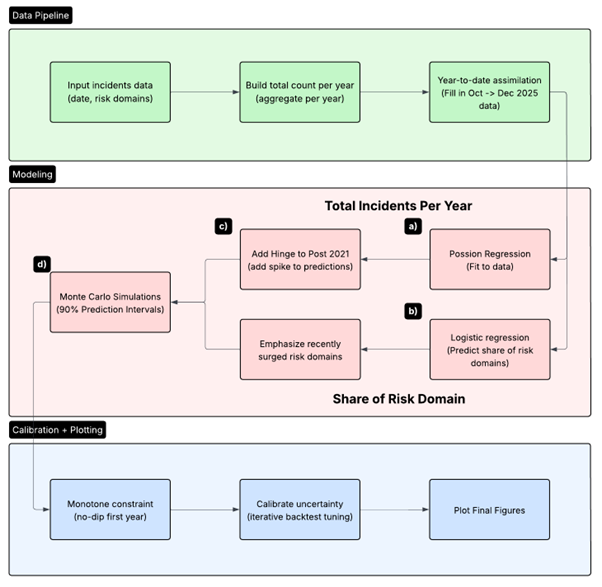
Figure 1: Flowchart for forecasting AI incidents: preprocess incident data, model totals and risk-domain shares, then calibrate uncertainty and plot final forecasts. Concepts in the highlighted process (a -> d) are shown in Figure 2.
Data Collection
To start, we gathered incidents from the AI Incident Database and its corresponding MIT Risk Repository, which labelled each incident with a risk area, from the 1990s to 2025. However, the newest year is often incomplete due to reporting lag, the time delay before all relevant incidents are added. To address this, we used a simple ‘so-far-this-year’ adjustment (year-to-date assimilation**) that scales partial-year counts based on typical monthly reporting patterns.
Hinge
We observed a marked increase in recorded AI-incident counts beginning around 2021. We added a hinge feature to divide the model into the time before and after the hinge, shown in process c). This lets us represent the spike in incidents after 2021 while keeping a stable model.
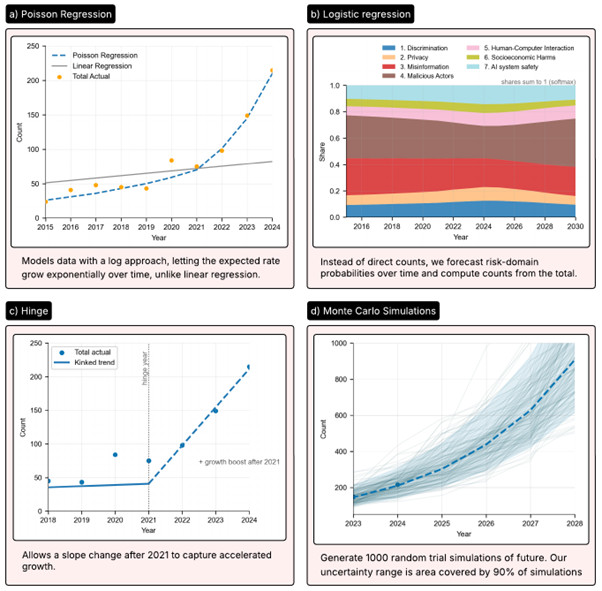
Figure 2: Highlighted Processes from Figure 1 explained.
Poisson Regression
To forecast yearly incident totals, we fit a Poisson Regression model shown in process a). This is a statistical method that estimates the number of incidents expected each year, where the event rate can change over time, for example, around 2021, when incident rates shifted. In Poisson Regression, we assume that incidents occur independently and that the model is well-suited for rare-event counting. We give recent years extra weight so the model can respond if the world is speeding up. It works well here because we expect incidents to grow exponentially over time, and Poisson regression allows the expected total to be multiplied by a constant factor each year.
Logistic Regression
To forecast the share of incident types, we use a logistic regression model shown in process b). This is a statistical technique that estimates the probability of each incident type out of all incidents over time. We place greater emphasis on risk domains that have recently surged***. This helps the forecast adapt when risk domain counts shift quickly. Logistic regression works well for predicting how a total splits into categories. Each risk domain’s predicted percentage stays between 0% and 100%, and all risk domains’ shares add up to 100%. That makes it a reliable way to split our total incident forecast across categories without producing impossible or inflated totals.
Monte Carlo Simulations
To represent uncertainty, we ran Monte Carlo simulations, which involve many randomized trials with slightly different model assumptions, as shown in process d). This method produces a range of possible future outcomes rather than just a single prediction. From these trials, we compute a 90% prediction interval, the range within which the true value should fall about 9 times out of 10 if future patterns resemble those in the model’s training period. Simulating many plausible futures lets us carry uncertainty from all parts of the model through to the final results and produce an interval that’s straightforward to interpret.
Backtests & Uncertainty calibration
We tested the method using a backtest, or “pretend-it’s-the-past” evaluation. For 2022–2024, we trained on earlier years, predicted 3 years ahead, and compared the predictions with actual outcomes. We compared our model to a baseline that simply extends the recent average forward. We then used the backtest errors to tune the model’s uncertainty settings (for example, how quickly counts are allowed to grow) so the prediction ranges match real-world near‑term behavior. We use backtest-based calibration because it uses real recent errors to tune our uncertainty ranges, instead of relying only on theoretical formulas that may not match this data.
Results
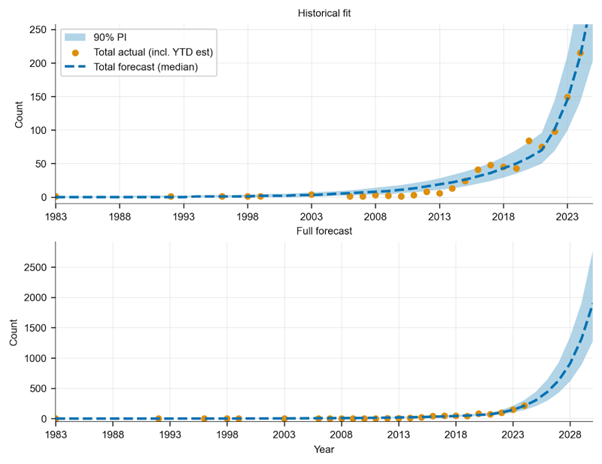
Figure 3: Zoomed historical fit (top) and full forecast (bottom) for the total-incident model with 90% prediction intervals.
Our forecast projects a 6- to 11-fold increase in incidents by 2030. This is rapid, compounding growth, not a slow rise. Even our lowest prediction, 6x, shows a major increase. In our backtests, our model didn’t always outperform the baseline each year, but it performed much better in 2024, when incidents surged. We argue this is an important tradeoff since modelling acceleration matters most when the world shifts quickly.
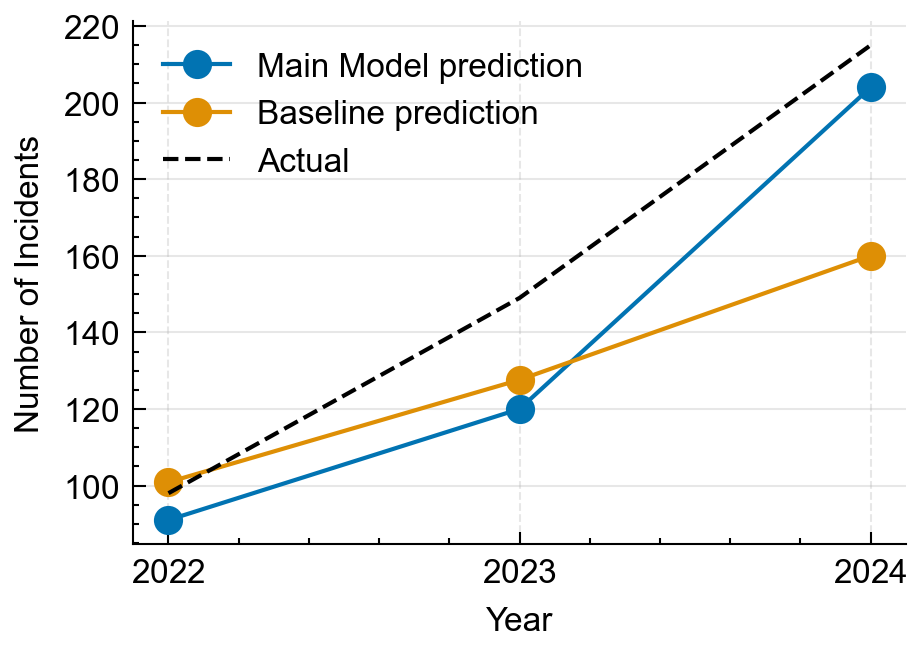
Figure 4: Backtest comparison (2022–2024) showing Poisson Regression model vs naive baseline predictions against the observed totals.
Our forecasts by area show the fastest growth in harmful misuse, misinformation, and system safety failures. Other domains also rise, but these are most prominent under our assumptions.
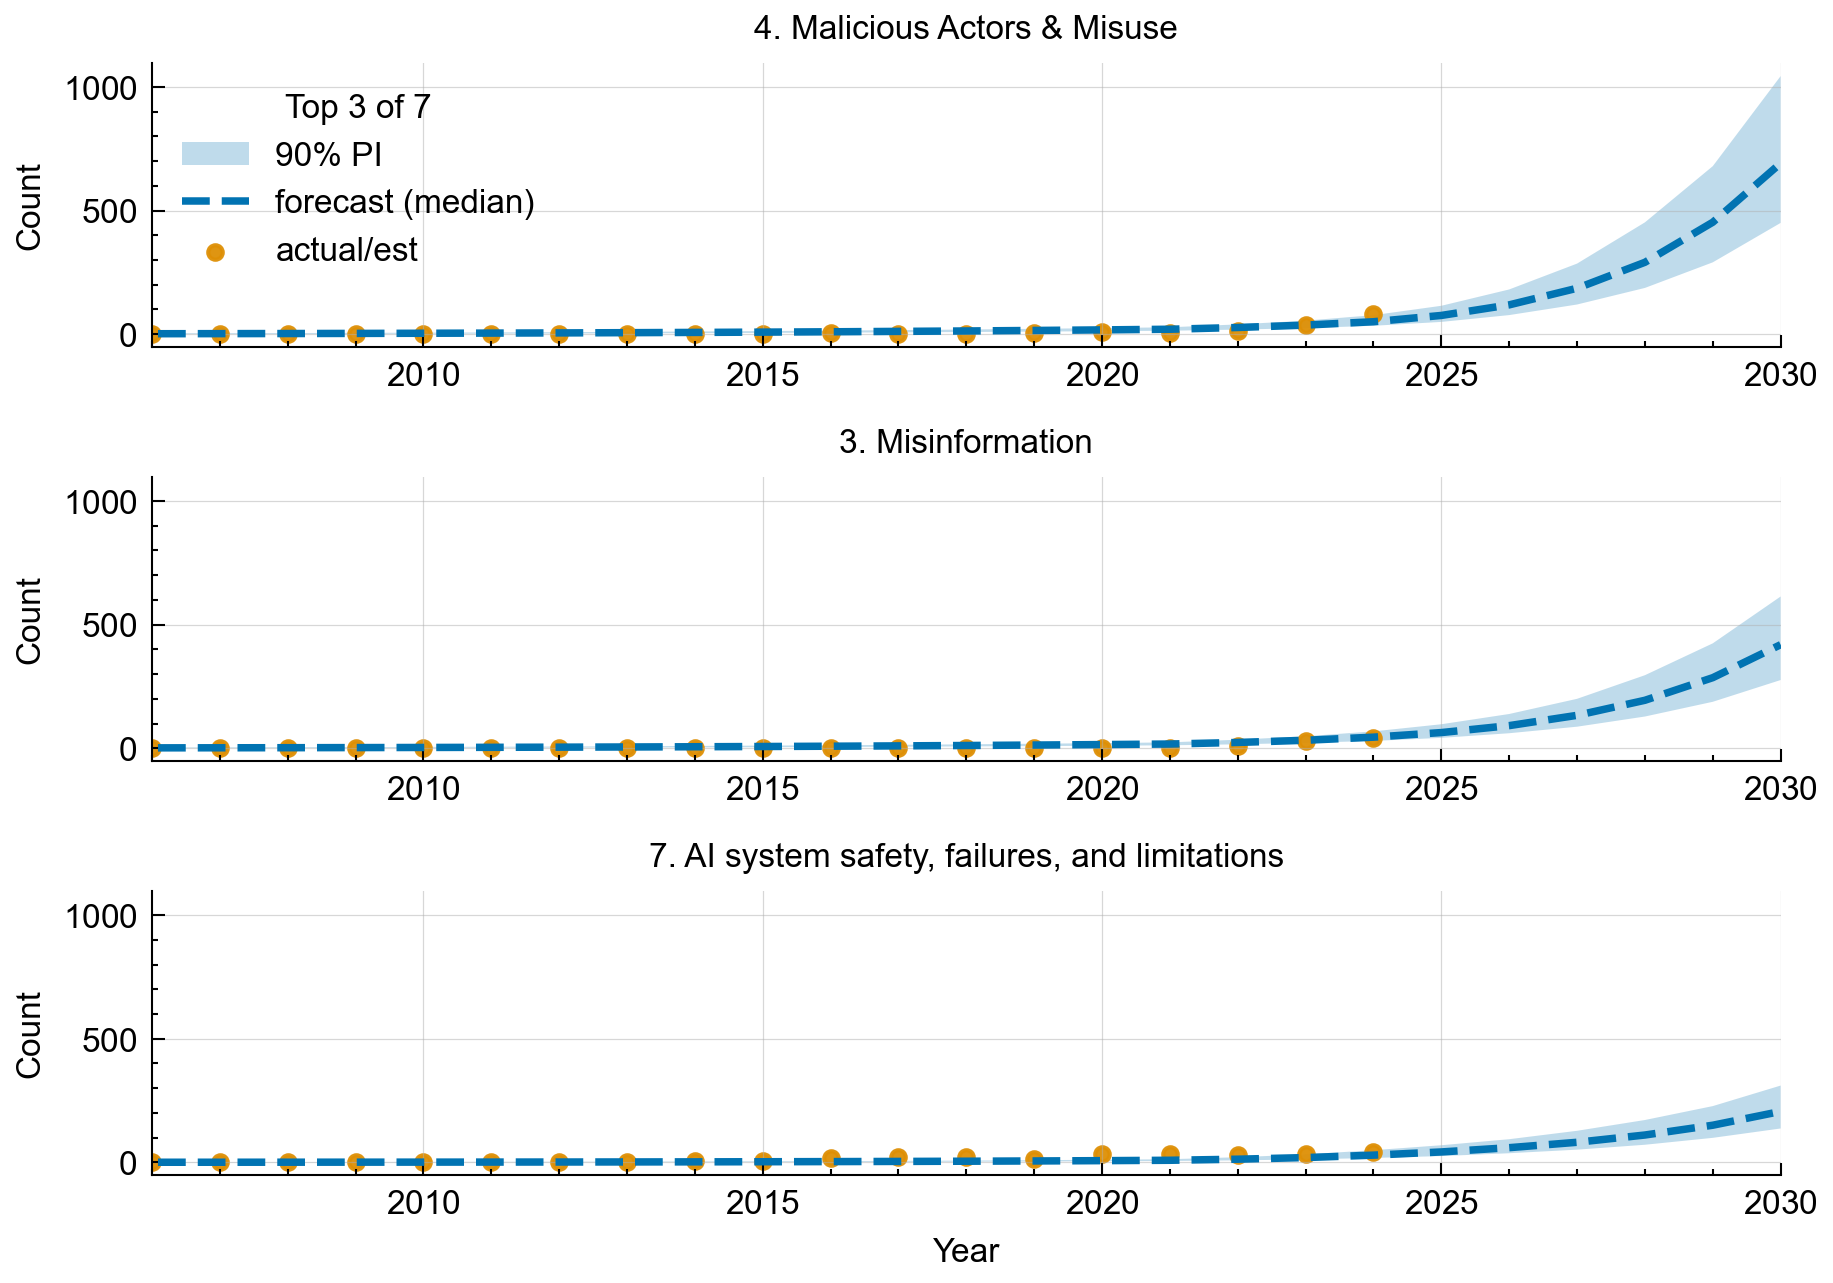
Figure 5: Forecasts for the top 3 of 7 risk domains, showing historical counts and 90% prediction intervals through 2030. Top 3 risk domains are: malicious misuse, misinformation, and system safety failures.
Conclusion
We predict a 6-11x increase in AI incidents, mainly in malicious misuse, misinformation, and system safety failures. We’ve done extensive modelling, testing and calibration to ensure that our model can reliably forecast the number of AI incidents in the short-term future. A forecast is not a prophecy, but it can serve as a risk radar. We predict the sharpest increases in 1. Malicious Actors, 2. Misinformation and 3. AI system safety failures. Policies should target these risk domains. Incident forecasting lets stakeholders focus resources on these high-growth, high-risk areas. Some of our assumptions and limitations are:
- The incident database only tracks public incidents, misses unreported problems, and changes as rules and definitions change.
- Our forecasts are therefore forecasts of recorded incidents, not a perfect measurement of all AI harms.
- Since the AI incidents database is regularly updated with new incidents. Our models and forecasts need to be updated with this new data to stay reliable for ongoing policy interventions.
- We also note that 50% of reports are compiled by a single person, which may have introduced systematic bias (for example, risk domains that may have been over-reported).
- We assume that recent trends in the number and mix of incidents suggest what will happen soon, and we weigh recent years more in our model.
- Furthermore, we do not account for future policy interventions (such as the upcoming EU AI Act) that may change the number of AI incidents over time.
- Our model assumes that the number of AI Incidents will continue to increase indefinitely, whereas in reality, AI would likely reach a point of full adoption, at which the incident rate would level off.
Anticipating failures is a prerequisite for mitigating them at scale. Incident forecasting is one practical way to support proactive action. We recommend that governance decisions be made to mitigate abuse from the risk domains: malicious misuse, misinformation, and system safety failures. We endorse further work on AI forecasting and this database. Explore the repository and reproduce the forecasts using our open-source code on GitHub.
Future Work
Next, we want to improve model accuracy by:
- Measuring Reporting Lag: Incidents are reported and added to the AI incidents database after they occur, so the current database is incomplete. We can measure this and account for these unreported incidents.
- True Harm Rate: The incident database reports incidents, which may reflect the true harm rate or increased reporting. We can measure media coverage of AI incidents as a proxy for detection and derive a harm rate.
- Analysing victims of incidents: We can use AI labelling to categorise which groups of society have been most affected by AI incidents.
- Severity/impact enrichment: Incident severity varies widely. Measuring and analysing these can aid policy recommendations. The number of reports per incident might indicate severity and impact.
- Policy intervention scenarios: Predict the impact of upcoming or possible policies on the number of AI incidents.
- With the incident database alone, credible causal estimates of policy effects are difficult because recorded incidents mix true harms with changing detection and reporting. What is feasible now is scenario analysis that makes policy assumptions explicit, while stronger causal designs likely require external covariates and more post-intervention years.
Contact: https://github.com/cluebbers/ai-incident-forecasting
We thank Apart Research for hosting the AI Forecasting Hackathon that initiated this project. Apart Labs assisted in funding and supporting the research, without which this work would not have been possible. Thank you to all organisers, judges who provided insightful feedback on our initial draft, and the community for an incredibly collaborative event. Thanks to the Responsible AI Collaborative for curating the AI Incident Database.
Additional References
Paper on AI Incident Database: Preventing Repeated Real World AI Failures by Cataloging Incidents: The AI Incident Database
Paper on MIT MIT AI Risk Repository Taxonomy: A Comprehensive Meta-Review, Database, and Taxonomy of Risks From Artificial Intelligence
Footnotes
*Risk domain: A board category of risk as defined by MIT AI Risk Repository by this link
**Year-to-date assimilation means we estimate a full-year total from partial-year data by using historical seasonality in reporting; this is a pragmatic fix for reporting lag, not a claim about when incidents truly occurred.
***“Surge” means a category’s share increased sharply in the most recent period compared to its earlier baseline; we use this to avoid underreacting to sudden shifts.